Summary
Watch List Triggers can now include trending information from the last three years such as 10yr Return Rank <=50 for 4 of the last 6 quarters. While current rankings are valuable, including trending evaluations directly within the automated triggers can increase the integrity of the due diligence process while also reducing the volatility of investments going on (and off) the watch list.
A total of 6 new report sections are now available in the customizable Monitoring Reports! The State of Affairs and the Annual Investment Options Cost sections highlight additions that allow users to show greater detail in client meetings.
New Feature – Trends within Watch List Triggers
Each data point can now be separately configured within a Watch List Trigger to include trending information from the last three years. For example; Sharpe 5yr Rank <=50 for 3 of the last 4 quarters and 5yr Return Rank <=40 for 6 of the last 8 quarters.
In addition to this configuration option, the Watch List Breakdown report section has been updated to include 12 quarters of due diligence history for each data point within the watch list trigger. Depending on the trigger configuration, you will see which quarterly data points affected the current Watch List status and which did not. This trending view provides significant value beyond looking at the current data point rank which was shown in the past.

New Feature – New Monitoring Report Sections
State of Affairs – A prominent section in our original Monitoring Report, the State of Affairs takes a high-level overview of a client’s entire portfolio and highlights areas of action. The section can be configured to exclude the Fi360 Fiduciary Score, Assets and IPS Alignment Warnings if not desired. The State of Affairs will appear after the cover page in in all of the default Monitoring Report templates.

Annual Investment Options Cost – The annual investment options costs section provides a synopsis of the investment fees charged to a client summarized on an annual basis. This section allows advisors the opportunity to disclose various components of the expense ratio and provide an analysis of each investment’s expenses compared to its peer group.
This is the same section from the Cost & Services report, but it is now available directly within a Monitoring Report template, so you don’t have to generate two separate PDFs. The other two cost & service report sections will be coming to the Monitoring Report soon. The investment costs section will appear in all of the default Monitoring Report templates.

Documentation Sections
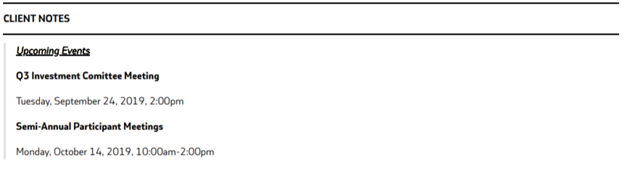
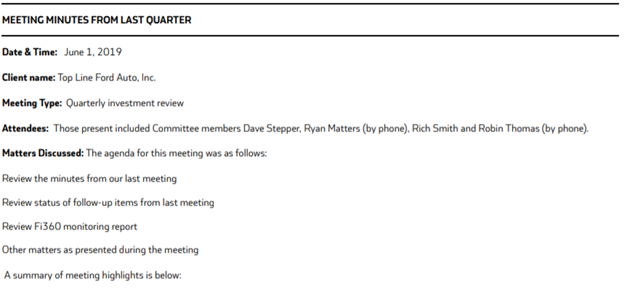
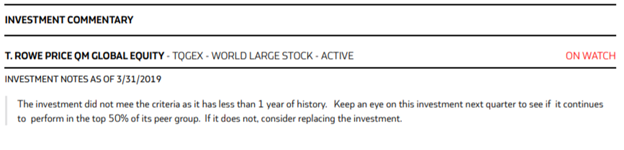
Stand-alone sections for Client Notes, Meeting Minutes, and Investment Commentary are now available within a Monitoring Report. These sections further our objective to generate 1 PDF with all of the necessary info for an advisor’s client meeting.
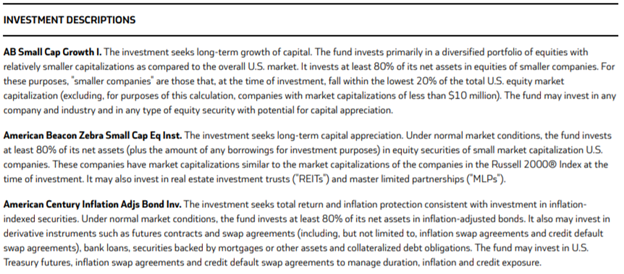
Investment Descriptions –This section simply includes a short description of each investment in the report. Including multiple descriptions on one page helps cut down on lengthy reports instead of including the full factsheets.
Improved Feature – New System Fields in IPS Templates
Three new system fields have been added to the IPS Template Editor (Projected Return, Projected Standard Deviation, and Projected Large Loss Scenario). Previously, users would have to calculate these metrics outside of the system and manually enter them into each client’s IPS questionnaire. Now, based off the asset class information input in the IPS, these data points will be calculated automatically and dropped into the position specified in the Template.
Improved Feature – IPS Font Correction
In the past, the generated IPS PDF had font type and spacing differences between the template language and the corresponding answers (what you entered during the questionnaire process). This issue has been corrected resulting in a more professional looking document.
Improved Feature – Fi360 Fiduciary Score Scatterplot
The scatterplot chart within the Research and Monitoring Report Templates has been updated to address two commonly reported issues. The bubble sizing has been altered to show more deviations in sizes based on the assets. Previously, it was using the same size bubble for many of the assets. When more than 360 investments were included the chart, the coloring was previously defaulting to all be the same. It now assigns various colors like it does for charts with less investments.
Improved Feature – Integrations
We have more integrations to announce! The following providers will launch in the coming months:
- BPAS
- First Mercantile
- Ktrade
- Lincoln Financial
- TPPKC